Effect of mean load, load range, and frequency on the power generated by piezoelectric crystals
S.M. Allameh, O. Akogwu, W.O. Soboyejo
Abstract
This paper presents the results of a preliminary study of the effect of loading parameters on the performance of piezo crystals. The output power of the crystals was observed to increase with parameters such as frequency and the dynamic load range but slightly decreased with mean load. The efficiency of the crystal was calculated based on the mechanical energy applied to the piezo crystal. The ratio of the electrical output to mechanical energy input was taken ad the efficiency of the crystal. This ratio was seen to increase with the cycling frequency and with the dynamic load range. However, increasing mean load caused the efficiency to drop significantly. The implications of this study in the design and applications of piezoelectric power generators are discussed.
I. Introduction
Conversion of kinetic energy
to electrical energy has been investigated by a number of researchers for
electrical power generation [1-6].Piezoelectric materials have
been investigated as essential elements for high-power pulse generation [1-6]. Electrical energy is
generated when an applied force overcomes internal inductance or capacitance of
a material. For a piezoelectric material this internal fields are stored the
ohmic lattice of the material. Mechanical deformation of this material by
applying load in static or dynamic cases generates the output voltage required
to power the piezoelectric pulse generator. Experiments have been performed by
applying quasi-static or dynamic stress [7]. They reported that dynamic
and quasi-static loading produced equal magnitudes of output voltage. They also
reported that the dynamic loading produced a unidirectional voltage while the
quasi-static case generated a bi-directional voltage. However, Engel at al [5] have reported different
results for similar experiments performed on the piezoelectric material for
both stresses. They discovered that the dynamic loading yielded a much higher
output voltage (up to 10 times more) than the quasi-static case. They compared
their experimental measurements on power generation with predictions of simulations. The theory finds that the material thickness to
cross sectional area ratio (TAR=hpiezo /A) can be used to maximize
output power. A higher TAR results in a higher output voltage but a lower
output current. In an effort to maximize output power, the voltage and current
have to be maximized. The overall effect of thickness to area ration (TAR) will
be dominated by the larger contribution of voltage to the product of voltage
and current. In other words, piezoelectric power output increases with
increasing TAR.
To achieve this, two models have
been proposed. The mechanical model that provides information on the
displacement (deformation) of the material due to applied force and thus the
generated voltage. The electrical model is used to find circuitous conditions
needed to generate maximum current.
The purpose of this study is to investigate and present the output power generated by the piezoelectric power generator based on the proposed models. In this effort, we set up experiments comparable to earlier works and dynamically loaded the system at different frequencies, load ranges and applied different loads (resistor values) at the output. The results obtained are also discussed.
II.
Experimental Procedure
Piezoelectric crystals were
obtained from Staveley Sensors Inc., East Hartford, CT. Various characteristics
of the crystal is tabulated in Table. They had a diameter of 25 and a thickness
of 6.3 mm. The crystals were sandwiched between two Al blocks to acquire or
impart electric signal to them. One Al block were then placed in load train
insulated from other components by a ZrO2 block. The ZrO2,
was housed in an Al block connected to load cell which was mounted on an x-y
stage. The other Al block covering the piezo crystal was connected to a
piezoelectric actuator made by Polytec PI, Inc. (MA, USA). The latter was
powered by a wave function generator that produced sinusoidal signals, with
different frequencies, different amplitudes, and different offsets. The signal
from the wave function generator was then sent to a PI amplifier and then fed
to the PI piezoelectric actuator.
A range of frequencies from 0.1 to 20 Hz were chosen for the first set of tests conducted at a cyclic load amplitude of 52 N and a constant mean load of 30 N. One set of experiments was conducted with a varying load range of 27 to 54 N at a constant mean load 36 N. Another set of tests was performed at a constant load range of 53 N but at a varying mean load of 3.7 N to 4.4 N. The set up is shown in (Figure 1).
III. Results and Discussion
(a) Effect of Loading
The results of mechanical testing
of the piezo crystal are summarized in (Figure 2)(Figure
3)(Figure 4).
The variation of the output voltage with load is shown in (Figure 5). The output voltage increases with
the load range in a near-linear manner.
It clearly shows that the dynamic range of the applied load is directly
responsible for the output power.
The effect of mean load is
illustrated in detail in (Figure
6). The tests were performed at a
constant load range to exclude its effect on the output voltage. The frequency
was also maintained at 10 Hz. The effect of mean load on the output voltage is
seen to be small. The results show an inverse dependence of the output voltage
on the mean load. This implies that for a given dynamic load range, the highest
output power is achieved at lowest possible mean load. Mean load here may be
thought as isostatic pressure in piezo crystal that affects the mobility of
electrons in the crystal lattice.
The effect of frequency on the
output voltage is shown in (Figure
7). The change in frequency is
seen to change the out put voltage significantly. However, this change in
output voltage on the loading frequency is linear as seen in (Figure 3). The linear dependence of the output
voltage on frequency can be understood given the fact that more mechanical work
is performed when the piezo crystal is loaded at a higher frequency. In fact
the mechanical work that is performed on the piezo crystal is proportional to
the area under the load-displacement curve. However, this area does not
significantly change with the strain rate for this crystal, (e.g. same amount
of work is performed at a higher strain rate), then more cycles will mean more
energy input into the crystal. This higher energy input is seen to have yielded
a higher energy output (manifested by a higher output voltage). Doubling the
frequency to 20 Hz translates into a near-doubling in the output voltage as
seen in (Figure
3).
All these tests were performed with
a resistor attached to the crystal. This resistor was chosen to be 1.1 MW. In this manner, the output voltage was representative of the
power output of the crystal through the relationship: P=V2/R. The
dependence of the power output on frequency and dynamic load will then be
through this power law, meaning, doubling the frequency will quadruple the
output power. An interesting outcome of this experiment is that the power
output increases with square of the values for frequency and dynamic load
range. This means that the efficiency of the crystal is a function of the
frequency and load range, increasing with both of these factors.
Two important conclusions can be
made based on the outcome of these experiments. The first one points to the
application of piezoelectric crystals in higher frequency applications where
higher efficiencies are achieved. The second one points to the higher dynamic
load range applications where efficiency maximizes. In both of these
applications the mean load should be minimized in order for the efficiency to
be optimum.
The effect of dynamic load range is
shown in (Figure
8). Increasing the dynamic load
range at constant mean load at a frequency of 10 Hz is seen to increase the
output voltage of the piezo crystal. The increase in the output voltage with
the load range is summarized in (Figure
8). There is a significant change
in the output voltage with an increase in the dynamic load range. The effect is
seen to be much greater at higher load ranges. The magnified effect of load
range will greatly boost the efficiency at higher load ranges.
The output voltage of the crystal
varied linearly with the value of the resistor used across the two leads of the
multimeter. This variation is depicted in (Figure
4). The output voltage increases
linearly with the resistance attached to the crystal. Since power is a square
function of voltage, and increase in the resistance will greatly increase the
power extracted from the piezo crystal.
The effect of cyclic loading on the
output voltage can be compared to the results of Engel et al.[1]. The output voltage
predicted from the formula
![]() (1)
(1)
where Vpiezo is the voltage
across the piezo crystal, d33 is the force sensitivity of the crystal, Cpiezo
is the capacitance of the crystal F is the applied force. Equation (1) predicts
a voltage of about 10 V at a load level of 50 N. Without the external resistor,
the cyclic voltage, measured in this study was bi-directional with a total
range (minimum to maximum) of ~ 5 V.
The power output of the piezo
crystal as determined by the voltage across a resistor placed parallel to the
piezo varies with the resistor. This variation in illustrated in (Figure 9). This log-log plot clearly shows an
increase in the consumable power extracted from the piezo crystal with the
value of the external resistance. It should be noted that power consumed in the
external resistance is inversely proportional to the value resistance.
![]() (2)
(2)
However, the output voltage
increases with increasing resistance. Since the effect of voltage on the power
is greater than the effect of resistance, the net effect of increasing
resistance on the amount of extracted power is positive.
(b) Efficiency of Piezo Crystal
For
piezo electric crystal with a capacitor of 2.8 nF under cyclic loading, the
stored energy per cycle time tcycle can be calculated as:
 (3)
(3)
With no external resistance, the
output power of the piezo will be ~ 3.75 x 10⁻⁷ W. As expected, this
value is greater than the energy consumed by the external 2 MW resistance (e.g. 1.75 x 10⁻⁷ W). To calculate the
efficiency of the crystal, under different loading conditions, we need to
determine the amount of mechanical work performed on the crystal.
 (4)
(4)
Here force (F), applied on the crystal, is measured directly by the load cell in the load train. It will include forces originating from the acceleration of the piezo mass, damping of the piezo crystal and the elastic response of the crystal. Since the sum of all forces is measured instantaneously, there is no need to calculate various force components separately. Using parameters presented in Table 1 for the piezo crystal used in this study, the efficiency is determined as the ratio of the electrical power output of the crystal to the mechanical power provided to the crystal to the consumed output using Equation (4).
The results of variation of the
efficiency with the dynamic load range is presented in (Figure 10).
As expected the efficiency of the piezo crystal increases with increasing load
range. For all data points, the mean load has been maintained constant at 30 N.
The increase in the efficiency is nearly linear. A similar trend is observed in
the variation of efficiency with frequency (Figure
11). More mechanical work applied
on the crystal generates more electrical power. Frequencies used in this study
are small enough to allow full relaxation of the crystal between loadings. This
leads to additive effect of sequential cycles that impose mechanical work on
the crystal.
The most intriguing result of this
study is illustrated in (Figure
12). The efficiency of the piezo
crystal drastically decreases with increasing mean load. There are two
contributions to this effect. The smaller contribution comes from the
hydrostatic pressure that is applied to the crystal at higher mean loads. This
reduces the output voltage, possibly by affecting the mobility of the electrons
in the crystal lattice of the piezo material. The more important factor in the
loss of efficiency with the mean load comes from the huge increase in the
mechanical work expended in the actuation of the piezo crystal. Higher mean
load dramatically increases the mechanical work. In conjunction with a constant
load range, it leads to a significant drop in efficiency.
(c) Implications
The results of this study shed
light on a number of important parameters that affect the efficiency of piezo
electric crystals. With the current renewed interest in alternative sources of
energy (as a result of higher oil and gas prices), optimization of processes
that produce electric energy from natural forces such as wind and waves becomes
important.
Some factors such as higher TAR
(thickness to area) ratio that are known to increase the power output of the
piezo crystals. Our results show the effects of some other factors such as the
effect of mean load that reduces the efficiency of power generation through the
use of piezo crystals. This implies that for better efficiency, the dynamic
load range should be chosen in a manner that minimizes the mean load.
The power extraction from the piezo
is also shown to depend on the external resistance used to measure it. At a
higher electrical resistance, power extraction is higher. This means lower
loads on piezo electric generators will yield higher efficiencies.
IV. Summary and Conclusions
Based on the results obtained in cyclic loading experiments performed on a piezo crystal the following conclusions can be made:
(1)
The output voltage of a piezo crystal across a
resistor is an indicator of the power output of the crystal. The magnitude of
this output voltage increases with dynamic load range, frequency and decreases
with increasing mean load
(2)
The power output of the crystal, as expressed by V2/R
greatly increases with the dynamic load range and with frequency.
(3)
The efficiency of a piezo crystal, as a function of
the power consumption through a resistor depends on frequency and load range.
It has been demonstrated that efficiency increases with frequency and with
dynamic load range. The efficiency of the piezo drastically decreases with
increasing mean load
(4)
The optimum power generation is shown to commence with
highest frequency, highest dynamic load range and lowest mean load.
References
1. T.G. Engel, C. Keawboonchuay, and W.C. Nunnally,
"Energy conversion and high power pulse production using miniature
piezoelectric compressors," IEEE
Transactions on Plasma Science, 2000, 28
(5) pp. 1338-1341.
2. T.G. Engel, W.C. Nunnally, J. Becker, R. Rahman, and C.
Keawboonchuay, "Research progress on compact kinetic-to-electrical energy
converters," Presented in Proceedings
of the 12th International Pulsed Power Conference, 1999, Monterey, CA, USA,
C.K. Stallings, H., Editor, IEEE, pp. 1287-1290 vol.1282.
3. T.G. Engel, W.C. Nunnally, and N.B. VanKirk, "Compact
kinetic-to-electrical energy conversion," Presented in Digest of Technical Papers 11th IEEE
International Pulsed Power Conference, 1997, Baltimore, MA, USA, G.V. Cooperstein,
I., Editor, IEEE, pp. 1503-1507 vol.1502.
4. C. Keawboonchuay and T.G. Engel, "Maximum power
generation in a piezoelectric pulse generator," IEEE Transactions on Plasma Science, 2003, 31 (1) pp. 123-128.
5. C. Keawboonchuay and T.G. Engel, "Electrical power
generation characteristics of piezoelectric generator under quasi-static and
dynamic stress conditions," IEEE
Transactions on Ultrasonics, Ferroelectrics and Frequency Control, 2003, 50 (10) pp. 1377-1382.
6. C. Keawboonchuay and T.G. Engel, "Design, modeling, and
implementation of a 30-kW piezoelectric pulse generator," IEEE Transactions on Plasma Science,
2002, 30 (2) pp. 679-686.
7. C.-N. Xu, M. Akiyama, K. Nonaka, and T. Watanabe,
"Electrical power generation characteristics of PZT piezoelectric
ceramics," IEEE Transactions on
Ultrasonics, Ferroelectrics and Frequency Control, 1998, 45 (4) pp. 1065-1070.
Table I. Characteristics of
the piezo electric crystal used in this study
Properties |
Symbol |
Magnitude |
Units |
|
Diameter |
d |
15 |
mm |
|
Thickness (mm) |
h |
3 |
mm |
|
Young’s Modulus |
E |
111 |
GPa |
|
Capacitance |
Cp |
2.08 |
nF |
|
Load proportionality constant |
d33 |
598 |
C/N |
List of Figures
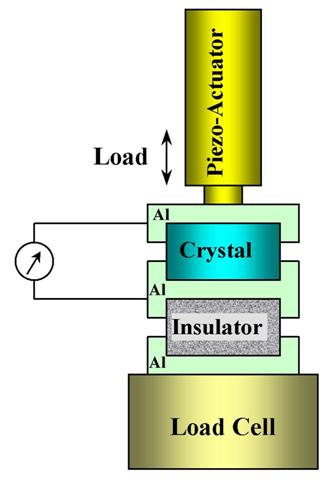
Figure 1. Schematic of experimental setup for the examination of effect of load range, mean load and frequency on power generation of piezo crystal
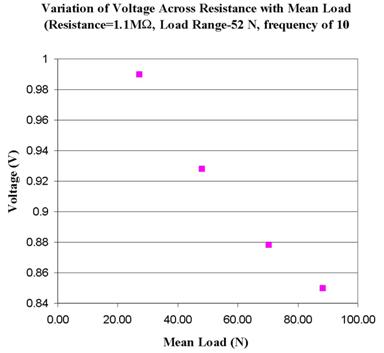
Figure 2. Effect of mean load on output voltage
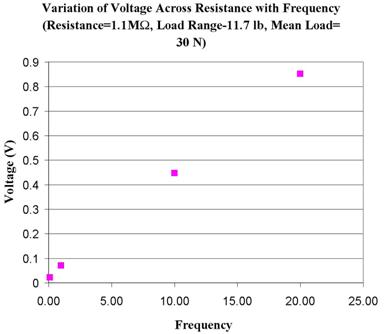
Figure 3. Effect of frequency on output voltage
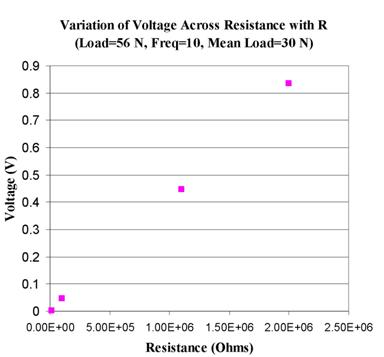
Figure 4. Voltage vs resistance
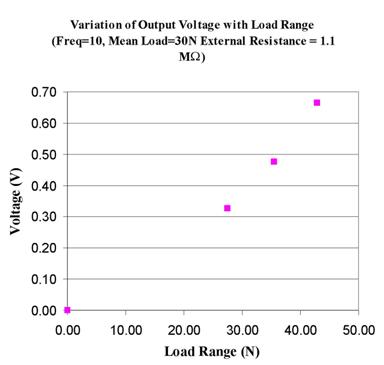
Figure 5. Voltage vs Load Range
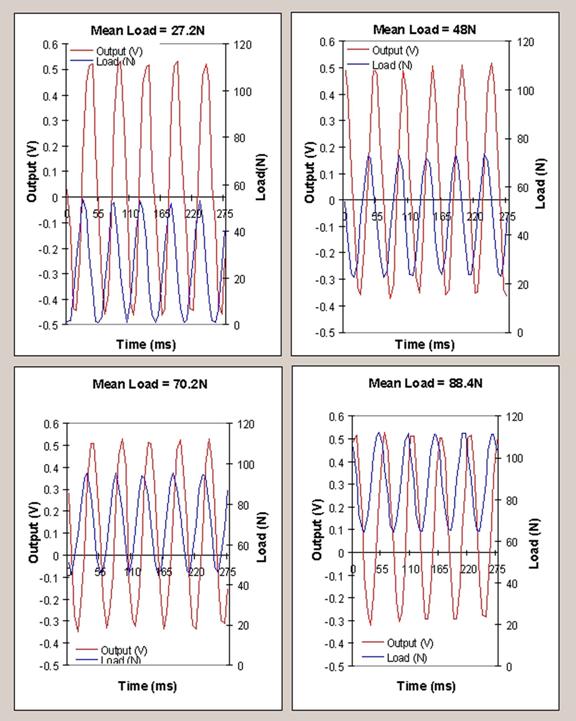
Figure 6. Variation of piezo crystal response with Mean Load
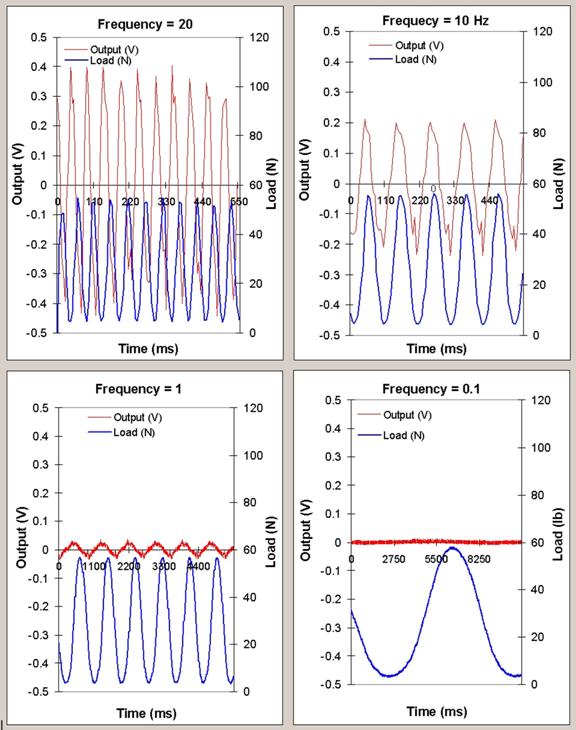
Figure 7. Variation of piezo crystal response with Frequency
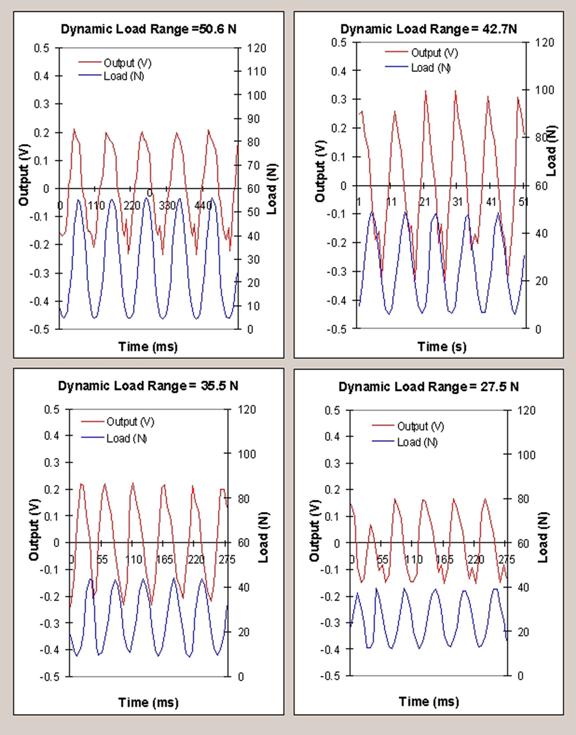
Figure 8. Variation of piezo crystal response with dynamic load range
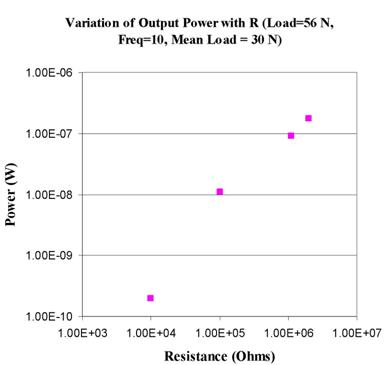
Figure 9. Variation of output power with resistance
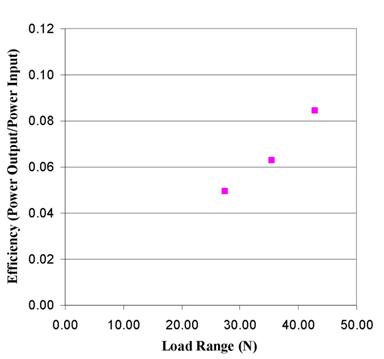
Figure 10. Variation of efficiency with load range
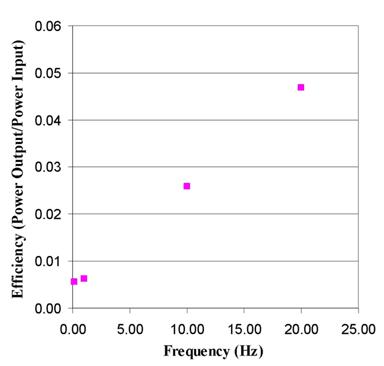
Figure 11. Variation of efficiency with Frequency
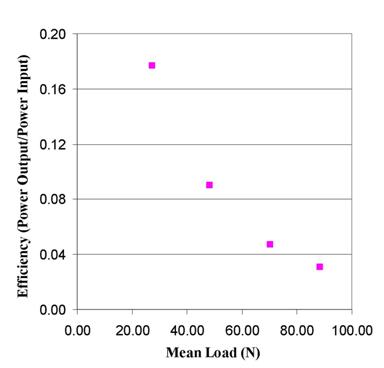
Figure 12. Variation of efficiency with mean load